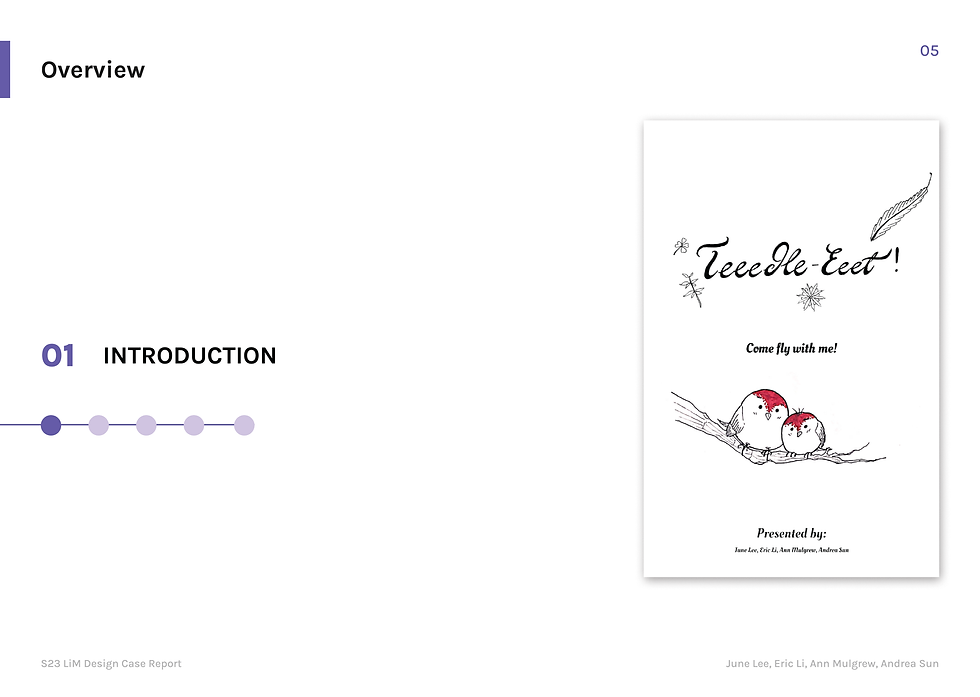
Teedle-Eet: Come fly with me!
"Teedle-Eet: Come Fly With Me" is an interactive pop-up exhibit designed for the Carnegie Museum of Natural History, inviting visitors to explore the wonders of bird migration and the urgency of conservation through playful storytelling and immersive design.


Timeline
12 weeks, Spring 2023
Team
June Lee
Eric Li
Ann Mulgrew
Andrea Sun
Tools
Figma
Photoshop
Rhino
Physical Prototyping Tools
Role
UX Researcher
Designer
Fabricator
01 Defining the Problem
The Design Problem
Working with the Carnegie Museum of Natural History, we designed a pop-up exhibit for the museum surrounding the topic of Bird Migration and Conservation. How might develop an empathetic view to motivate people to contribute and take action? How might we increase outreach community programs surrounding the topic of bird conservation in an interactive, engaging way?
01 Design Problem
PROJECT BRIEF
Working with the Carnegie Museum of Natural History, the goal of this project was to design a pop-up exhibit for the museum surrounding the topic of Bird Migration and Conservation. From the museum, we were given this context:
"Powdermill Nature Reserve, the museum’s environmental research center, has monitored bird migration for over 60 years. By banding and tracking birds, researchers have gathered extensive data to study environmental change. Advances like radiotelemetry now offer deeper insight into flight paths. As climate change and habitat loss threaten bird biodiversity, understanding migration is critical for guiding conservation and systemic change."
- Carnegie Museum of Natural History

From this, we delved into the research through interviews with subject matter experts, online research, and more to narrow down our topic and decide what we want to highlight through our exhibit.
02 Learning & Design Research Synthesis
SUBJECT MATTER INTERVIEWS
To better understand bird migration and conservation in the Anthropocene, we interviewed four experts in the field. A shared insight emerged: raising public awareness is key. Our exhibit focuses on the relationship between birds and people—to build empathy and highlight human-driven solutions for migratory bird conservation.

Ann
June


Subject Matter Interview Key Insights
PERSONAL MEANING MAPS
We created Personal Meaning Maps (PMMs) on 11×17 sheets featuring a central diagram with three interconnected themes: Birds, Humans, and Nature. Participants were invited to write or draw around the diagram to explore these relationships. One team member facilitated each session while others documented through notes, photos, and recordings. After the PMM activity, we conducted interviews using prepared questions to gain deeper insight into participants’ perspectives.

PPM study at the Carnegie Museum of Natural History (CMNH)


PPM study samples
PMM FINDINGS
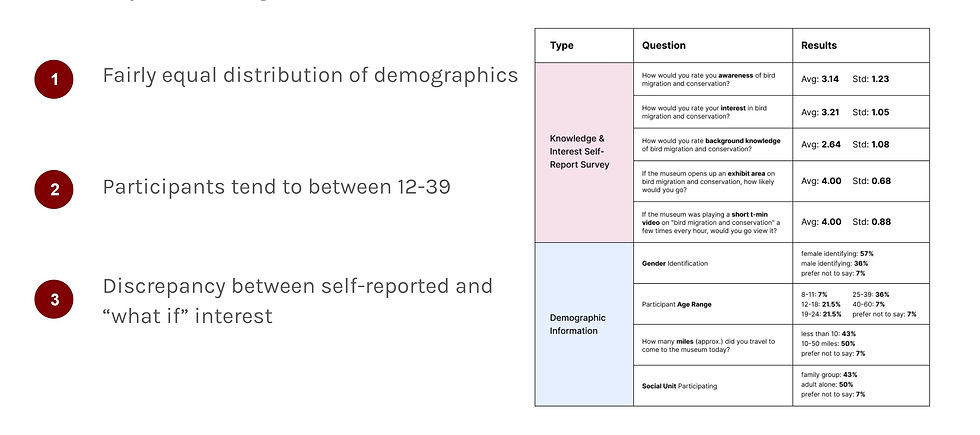
N = 14: 10 on-site volunteers in the museum, 4 online volunteers who visited the CMNH
Age range: (8-11 = 1), (12-18 = 3), (19-24 = 3), (25-39 = 5), (40-60 = 1)
Gender identification: (F = 8), (M = 5)
Social units: (7 adult groups), (7 family groups)
From the PMM Interviews, we found that most people knew a wide breadth of information, but little in-depth knowledge about their relationship to nature and humans. There were also knowledge limitations found between different age and education levels. Most people did not associate a connection between bird migration and anthropogenic consequences. Although our PMM results demonstrate primarily surface level knowledge, people rated themselves fairly high with an average of 2.6 out of 5. It seems like people are unsure of what they do not know.


POST-PMM INTERVIEW FINDINGS
After our PMM mappings, we asked each participant to answer a set of questions.


Opportunity Framing
People are very human-centric.
-
How can our design focus on the interaction of humans and birds? How do we put the human in the bird’s point of view to get them to empathize with this species and take action? How can we make people understand the bird crisis?
People want to take action, but do not know how they can contribute to the cause.
-
How can we encourage people to take action? And once encouraged, how can they take action and contribute to the cause?
From our studies, we developed a common theme...
"Close to Birds"
Our theme focuses on inspiring connections and realizations between the human and the bird.
03 Exhibit Concept Brainstorm
INITIAL DESIGN CONCEPTS
From our research we developed research questions and formed individual concepts for our project. We agreed on the theme of “Close to Birds” and delved into four concepts for our pop-up: Empathy of Birds, Appreciation & Audience, Awareness, and Action.

GUIDING SECONDARY RESEARCH QUESTIONS:
-
How might we inspire meaningful connections between humans and birds, motivate action for conservation, and expand access to community-driven outreach efforts?
-
How might we help people see from a bird’s perspective - building empathy that drives awareness, concern, and a meaningful commitment to take action for their survival?
-
How might we communicate the urgency and complexity of the bird crisis in ways that are personal, accessible, and empowering - so people feel moved to care and contribute?


04 Prototyping & Evaluation
ROUND 1: SPRING CARNIVAL @ CARNEGIE MELLON UNIVERSITY
From our research, we developed key research questions and explored individual concepts, ultimately aligning on the theme “Close to Birds.” This theme led us to frame our pop-up exhibit around four central ideas:
Empathy for Birds
01
Audience Appreciation
02
Generate more Awareness
03
Call to Action
04
For our field testing, we set up our prototype in a shared tent alongside another group in the early afternoon. We began by introducing participants to our high-level topic before guiding them through the interactive challenges. Throughout the experience, we recorded behavioral observations using a Visitor Engagement Profile sheet. After completing the activities, participants were invited to fill out a short survey to capture additional feedback.
Target Audience
College students and family groups.
Objective
Gather feedback on our initial prototype, with a focus on the clarity and design of each challenge and how effectively it communicates Anthropocene values.
Exhibit learning goals for participants
-
Migration is disrupted by human impact.
-
We can help protect birds.
-
Small actions make a difference.


Following our testing session, we gathered a range of observational and survey data to assess how visitors interacted with our prototype. The insights below reflect patterns in engagement, highlight areas of strength, and reveal opportunities for improvement as we refine our design.

VEP Evaluation (N = 31)
All participants demonstrated initial engagement, with 74.2% showing transition behaviors and 48.1% reaching breakthrough engagement. The most common action was “approaching the table,” while the least common included “inviting others,” “scanning the QR code,” and “connecting challenges to external topics.”
Survey Results (N = 14)
Respondents were primarily 19–24-year-olds in friend groups, with a gender breakdown of 5 female, 7 male, and 2 preferring not to say.


Feedback & Interpretation
-
The exhibit felt text-heavy; visitors preferred more visual content.
-
Cartoon panels were small and placed flat, making them easy to miss. Larger, upright displays may improve visibility.
-
The panel layout was counterintuitive; arranged right to left, while most visitors approached from left to right.
-
Visitors were reluctant to scan the QR code or use the provided phone—possibly due to weather or perceived effort.
-
Acrylic maps were overlooked unless visitors were already close, as they were also lying flat on the table.
Challenge 1: Acrylic Mappings
At Spring Carnival, our acrylic mappings were laid flat down on the table.
What went well
-
There was lots of interaction with these mappings. People regularly shuffled each of the layers around to compare them with each others.
Improvement Opportunities
-
Using the same color throughout made it hard to tell habitat loss from the underlying geography.
-
When the maps were stacked, the overlapping text became difficult to read.
-
The map layers frequently got mixed up on the table, causing confusion.
-
There wasn’t enough clarity between winter and summer habitat loss.
Challenge 2: Digital Game
A QR code was taped flat onto the table where participants could use our provided phone to scan and access the game or thier own phone.
What went well
-
The game generated lots of conversation between the facilitator and the visitor. There seemed to be many moments of discovery.
Improvement Opportunities
-
People rarely scanned the QR code unless they were prompted to.
Challenge 3: Window Decals
We had a cardboard label that stated how people can apply their bid window decals.
What went well
-
Many people were drawn to the bird window decals and took them home.
Improvement Opportunities
-
Although people were drawn to the decals, it was more so of a grab-n-go process with little to no learning occurring. They mostly just took the decal because it was free. It was unclear on whether or not they knew how to actually use them.
ROUND 2: SCITECH DAY @ CARNEGIE SCIENCE CENTER
For our second round of testing, we set up our iterated prototype on SciTech Day at the Carnegie Science Center. With a much younger audience in attendance, we gained a new perspective on how children engage with our exhibit. We introduced our core topic, guided visitors through the challenges, and observed their behavior using an updated Visitor Engagement Profile. At the end of the experience, we invited participants to take home zines and window decals as interactive takeaways.
Target Audience
Middle school & elementary school students.
Objective
Test our iterated prototype, observe whether visitors are engaged with the materials and can display more breakthrough behaviors.
Exhibit learning goals for participants
-
Migration is disrupted by human impact.
-
We can help protect birds.
-
Small actions make a difference.


Following our testing session, we gathered a range of observational and survey data to assess how visitors interacted with our prototype. The insights below reflect patterns in engagement, highlight areas of strength, and reveal opportunities for improvement as we refine our design for our final iteration.

VEP Evaluation Result
All visitors showed initial engagement; 93.6% reached transition behaviors and 77.4% reached breakthrough. “Approaching the table” was most common, while “pulling others to join,” “sharing insights,” and “asking deeper questions” were least observed.
Feedback & Interpretation
After iterating on our exhibit, transition behaviors increased by 20% and breakthrough behaviors by 29%. However, “pulling others to join” remained low—possibly due to fewer groups on SciTech Day or a lack of group-friendly challenge design.
Challenge 1: Acrylic Mappings
We created a new stand for the mappings to sit to help keep the layers organized and to display the mappings more prominently. We also changed the colors so that only the habitat loss was colored in and based on migration season (red for summer, blue for winter). Lastly, we moved all the text to the top since the stand covered it. We also staggered each of the temperature texts so they are legible even when stacked.
What went well
-
More people noticed the acrylic mappings when they were on the stand.
-
People could more easily define what was winter habitat loss and what was summer habitat loss.
-
People engaged more with the mappings compared to SciTech (but still less engaged compared to Spring Carnival).
Improvement Opportunities
-
The stand made the acrylic mappings become a bit too formal. People were hesitant to play with the data hands on unless prompted that it was okay to touch.
-
Instead of having all our mappings set up in the stand, we left half of them flat on the table to encourage them to grab the acrylics and interact with them.
Challenge 2: Digital Game
To improve accessibility and ease of interaction, we removed the QR code and the small provided phone, which many visitors were hesitant to use. Instead, we introduced an iPad with the digital game preloaded, allowing visitors to engage with the experience more comfortably and intuitively without needing their own devices.
What went well
-
A lot more people were drawn to the game when it was on the iPad.
-
Many felt that the small graphics were engaging and cute!
Improvement Opportunities
-
At points, the UI felt a bit confusing (people not understanding what was the correct answer, not knowing to scroll to get to the next page, etc.) - need to make subtle changes to make it more intuitive!
-
Some (primarily adults) felt that the quiz was too difficult since the information was too unfamiliar.
Challenge 3: Window Decals
To replace our original label, we created a take-home zine that accompanies the bird window decals provided at the exhibit. The zine offers background on the issue of bird-window collisions, explains the importance of using decals to reduce these incidents, and gives clear, illustrated instructions for proper placement at home. This addition extends the impact of the exhibit, allowing visitors to take direct action while deepening their understanding of the broader conservation effort.
What went well
-
The decals were still very popular. Many people took them home.
Improvement Opportunities
-
People did not feel as motivated to take the zine home.
-
Some felt that there was a disconnection between the cartoons and the window decals.
Summary of Design Implications for the Final Round at the Carnegie Museum of Natural History
-
Physical over digital: Across both testing rounds, visitors consistently preferred hands-on, physical interactions over digital ones.
-
Clear instructions matter: Visitors engaged more deeply when clear, visible instructions were provided—QR codes alone were not enough.
-
Visual clarity attracts attention: Raising panels, enlarging cartoons, and reducing text led to higher engagement and stronger emotional connection with the content.
-
Peer influence boosts participation: Visitors were more likely to join activities when they saw others participating. Designing for group interaction could foster shared learning and increased engagement.
05 Final Exhibit
The exhibit is framed to generate empathy for the bird and a realization of the anthropogenic (human-caused) actions taken that harms the bird. The exhibit allows you to play with the data hands-on, play a mini digital game, and create window decals to make you a contributor and supporter of bird conservation. So without further ado...
Welcome to Teedle-Eet: Come Fly with Me!
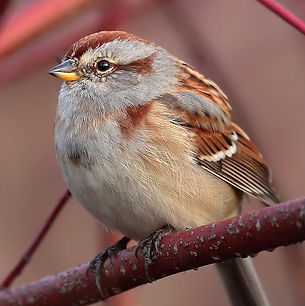
Teedle-eet! I'm an American Tree Sparrow! You might recognize me from your winter backyards and weedy, snow-covered fields across southern Canada and the northern United States. As early spring arrives, I begin my migration journey from the south to the far north to breed. However, I’ve begun to face various challenges along my migration journey because of human actions. Follow along my journey to learn about the challenges I (and other similar birds!) face and how you can help!
OVERVIEW
Our exhibit highlights three major challenges faced by migratory birds like the American Tree Sparrow: rising temperatures, habitat destruction, and building collisions. Through interactive elements—such as acrylic habitat maps, a digital coffee game, and customizable window decals—visitors can explore how human activity affects bird survival and discover small but meaningful ways to support conservation efforts. More details on each challenge can be found below.

Panel and activity

Ending panel and activity
DETAILS ON CHALLENGES & ACTIVITIES
Challenge 1: Rising Temperatures
The hotter our world gets, the more north I need to travel because I can’t survive in warmer temperatures. Right now my migration grounds are okay, but over time if temperatures keep rising then I’ll have nowhere to go. Come play around with my migration data hands on in the acrylic mappings. Each acrylic map layer predicts the habitat loss in response to rising temperatures. Feel free to stack and mix them around!


Challenge 2: Habitat Destruction
I rely on the open tundra of Canada and Alaska during my breeding season, but human activities like hunting, oil drilling, pesticides, and construction have altered my habitat and polluted the environment. This threatens not only my survival, but also that of other birds who live with me. Coffee production (surprise!) is one of the biggest contributing factors to my friends’ and I’s habitat loss. Come play this mini digital game to learn more about how you can help through bird-friendly coffee!


Challenge 3: Building Collisions
Flying through cities on my migration journey can be a dangerous time for a small bird like me. During nights, bright lights on skyscrapers can lure flocks like ours to crash into building facades. Local programs such as Lights Out Pittsburgh have helped us in the past during migration season so we do not get confused by artificial light. During the day, sometimes I mistake reflections of the sky or open fields on windows as a clear passageway because of its reflectiveness and transparency. To help me become less confused, take a window decal, decorate it as you’d like, and stick it on your window at home!


EXPERIENCE MAPPINGS
Within in our design process, we developed experience mappings to interpret how various visitors may interact with our exhibit. By mapping out these experiences, we were able to better understand and better design for these different visiting groups (families and students).

06 Reflections
As we wrapped up our exhibit development, we reflected on feedback from user testing and our final presentation to evaluate how well our design aligned with the museum’s goals and the values of the Anthropocene. This process helped us identify what resonated with visitors, where our design could be improved, and what opportunities exist for future iterations.
What Went Well
Our storytelling approach, especially the cartoon panels, built strong empathy around bird migration. Visitors enjoyed the hands-on activities, and the “low effort, high impact” message came through clearly. Bird sounds used during SciTech Day enhanced engagement, and the exhibit sparked casual group conversations.
What Needs Work
Some activities lacked clarity and felt disconnected from the story. The acrylic maps were hard to interpret, and the setup limited comparison. Time constraints reduced our migration challenges from six to three. Most activities encouraged solo engagement, and the final presentation lacked the sensory richness of earlier tests.
What's Next
We plan to clarify activity setups and reconnect them more clearly to the story. Expanding the journey to include all six migration challenges will add depth. We also aim to design for more group interaction and strengthen sensory elements like sound and lighting for a richer, more immersive experience.
05-292 Learning in Museums; taught by Marti Louw